
How do we measure the efficacy of things? I know, it is such a broad question to ask. But I really mean how do we know the things we are doing are working or leading to the result we seek?
In the marketing and business world, we often reference “KPIs” or “Key Performance Indicators.” KPIs are the metrics or data points we want to focus on prior to launching any type of activation or campaign.
In the sports world, data tracking is becoming more and more compelling/alluring to both rightsholders AND sponsors. They want to learn more about their fans and discover if the activations they are doing are working.
To achieve this, we have dripped various dashboard views and tracking methods for Unyfy operators to gain those insights about their users/fans.
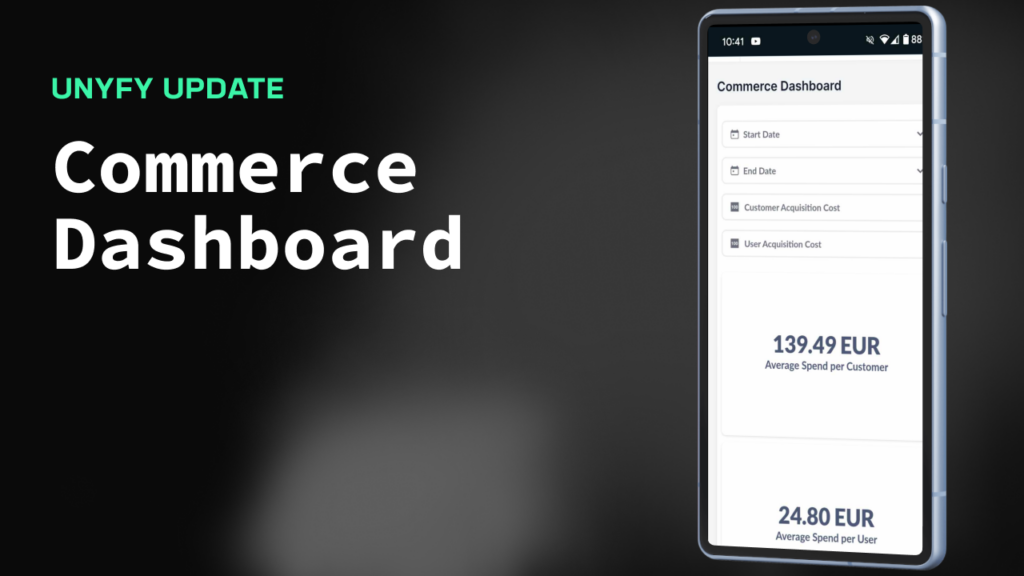
Now on Unyfy, we introduce the Commerce Dashboard which is a new tracking view that offers insights into user purchasing behaviors like average spend, lifetime value, and conversion rates.
Introducing the Commerce Dashboard
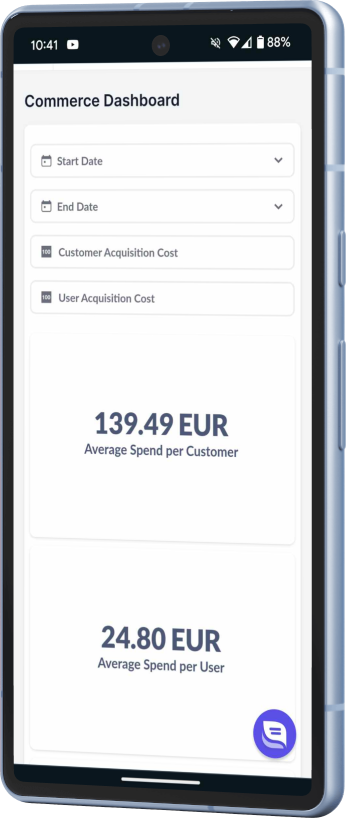
Unyfy is taking a significant leap forward with the introduction of the Commerce Dashboard, a new backend feature that provides operators with advanced user data. The dashboard includes information such as “average spend per customer”, “average spend per user”, “average customer lifetime value”, “average user lifetime value”, and “customer conversion rate”.
The Commerce Dashboard is designed to give you a granular understanding of your user base, helping you make informed decisions about your digital collectibles business. Here’s what you can expect from this feature.
Advanced User Data at Your Fingertips
The Commerce Dashboard provides a comprehensive view of user spending habits. You can track various advanced commercial KPIs like “average spend per customer” and “average spend per user”, “average lifetime value”, and “customer conversion rates”. This data can help you develop targeted marketing strategies, optimize pricing and determine the results of your platform activity.

Understanding Customer Value
The “average customer lifetime value” and “average user lifetime value” metrics allow you to understand the long-term financial value of your customers. This can guide your customer retention strategies and help you allocate resources effectively.
Tracking Conversion Rates
The dashboard also tracks your “customer conversion rate”, giving you a clear picture of how effectively you’re turning users into paying customers. This can help you identify and address any bottlenecks in your conversion funnel.
Unyfy: Empowering Operators with Data-Driven Insights
The Commerce Dashboard is a significant addition to Unyfy’s suite of features, enhancing our platform’s ability to provide operators with data-driven insights. This new feature underscores our commitment to giving operators the tools they need to manage and grow their digital collectibles business successfully.
In conclusion, whether you’re a sports brand, creator, or publisher looking to launch a fan-centric platform with an active and engaged community, Unyfy offers you the tools to do so. Harness the power of data with the Commerce Dashboard. Don’t miss out on this opportunity; check out Unyfy today and start building your own digital collectibles platform.